 www.impacttectonics.org
G.C. Herman,
PhD
March 22, 2026
BoreholeSectionPro_v35.exe (50.5 MB) User
Guide
Please email me at
gcherman56@yahoo.com if you're
interested in obtaining the program.
1.
INTRODUCTION
The Borehole Section Engine
(v.35) is a specialized structural geology tool designed to
project 3D borehole televiewer (BTV) data onto a 2D cross-section.
This is a MS Windows executable version of a python script that can help visualize a
site's hydrogeological or structural framework by reading comma-delimited files
that specify borehole features and well-log responses, and automatically createa two-a two-
or three-slide
PowerPoint presentation of the results.
The program reads data files for all
boreholes in a directory, plots the primary and secondary structures at their
specific positions and apparent dips in the cross section of specific azimuth, generates structural rose diagrams
(histograms) of each feature type,
optionally handles borehole
drift using vector displacement logic, and
optionally generates geophysical-log plots
if those files are in the folder. If the 'Drifted' borehole option is
chosen, the the geophysical logs are plot along the drifted borehole trace.
BTVVfeature logsfeature logs specify the primary and secondary geological structures
that are generated and placed directly into a 1:1 scale cross section in MS PowerPoint
along with an abstracted topographic profile, depth scale (Altitude - m), and
feature lege.d.
The program has three user-input prompts for specifying the borehole
directory, and two menus to set the borehole trace mode (vertical or drifted)
and specify the line scales of represented structural planes.
It uses set line colors for primary bedding or
layering/foliation (green), fractures (red), faults (black), and cleavage
(gray), but random, dark colors for any other type of features specified in the
BTV table under the 'Type' field. Line weights for planar features are set to
1.0 pt. weight. Geophysical logs are plotted using a medium-gray, continuous
line (0.5 pt. weight) that can be copied or moved as a group. Conductive planes when noted are prioritized
in the symbol hierarchy; that is, if a plane is noted as 'Kind'
'Conductive', it is scaled and colored as 'Conductive' despite being of Types
'Bedding' or 'Fracture'.
Tabular input files
Example comma-separated-value (csv) files are shown below.
Well data (Wells.csv):
Well,Latitude,Longitude,Altitude (m)
SB1,40.358869,-74.767685,57
SB3,40.358963,-74.766593,53
SB6,40.359119,-74.767697,57
BTV data (SB1.csv):
Id,Altitude (m),Azimuth,Dip,Type,Kind,Sense,BHAzm,BHTilt
1,47.46,43,188,Fracture,,Mineralized,214,3
2,46.24,34,25,Bedding,,,208,3
3,45.94,62,198,Fracture,,Mineralized,211,3
4,45.02,15,19,Bedding,,,219,3
5,42.89,27,185,Fracture,,Mineralized,220,3
6,41.98,34,14,Bedding,,,216,4
7,41.67,61,198,Fracture,,Mineralized,220,3
Gamma-ray log (SB1Log.csv):
Altitude (m),Response
43.39,82.0313
43.29,76.2031
43.19,95.6094
43.09,76.8164
42.99,97.5859
42.89,99.9023
2. MS POWERPOINT OUPUT GRAPHICS
Example program output formappand cross sectionand cross sections with rose diagrams
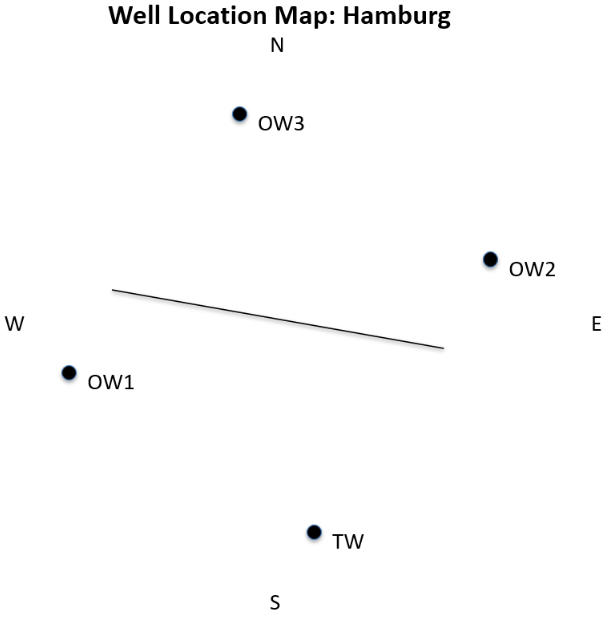
are shown below.Four water wells in fractured
dolomite
Slide 1

Slide 2
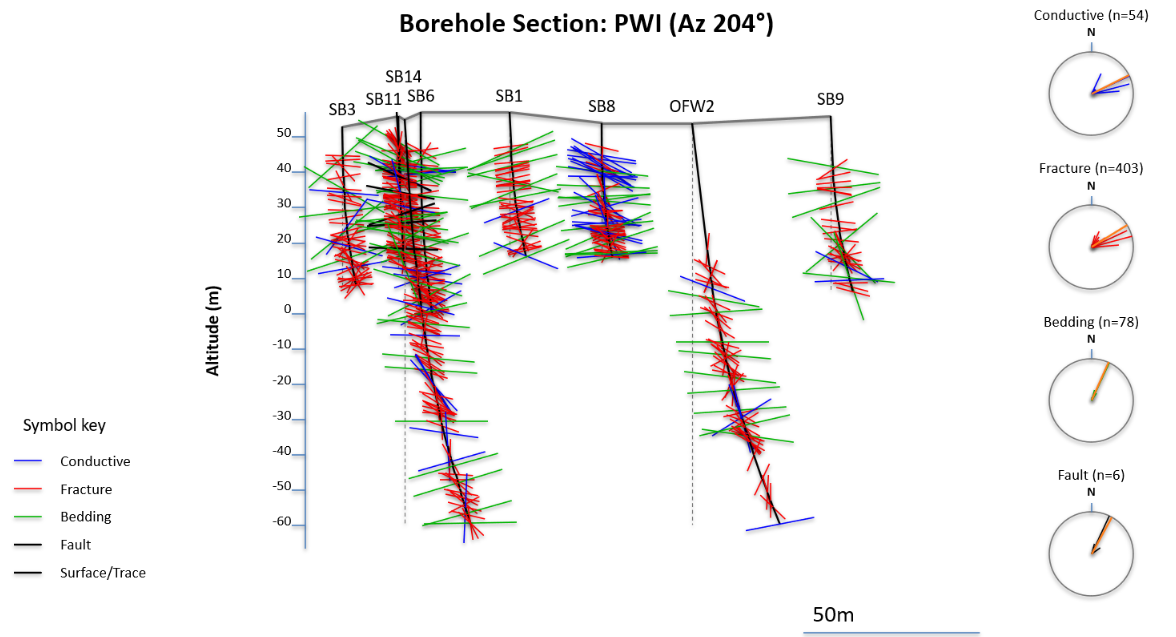
Eight water wells in fractured mud rock, 2 with gamma logs.
Slide 1
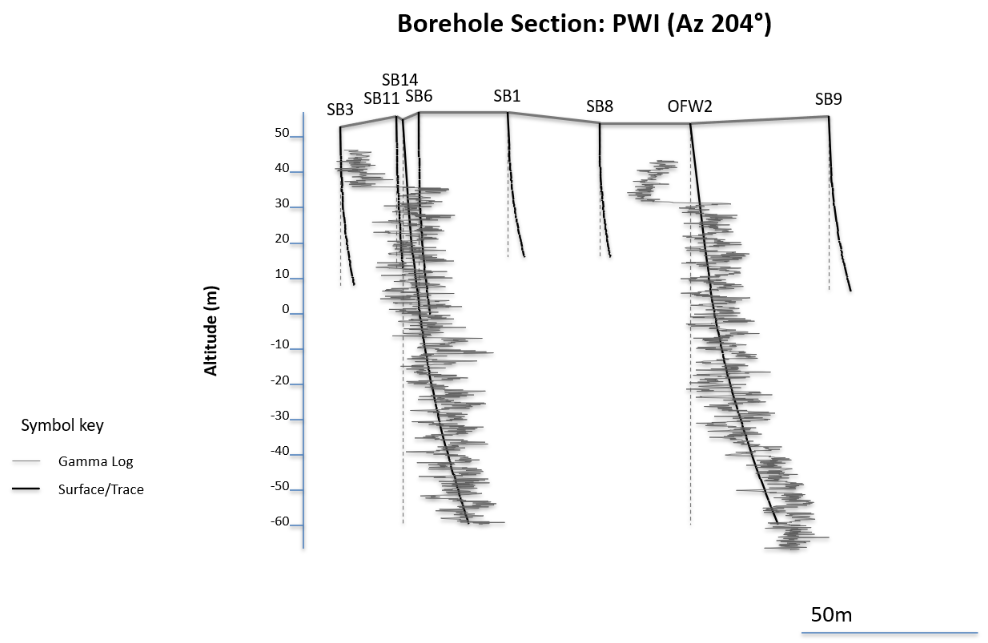
Slide 2
Slide 3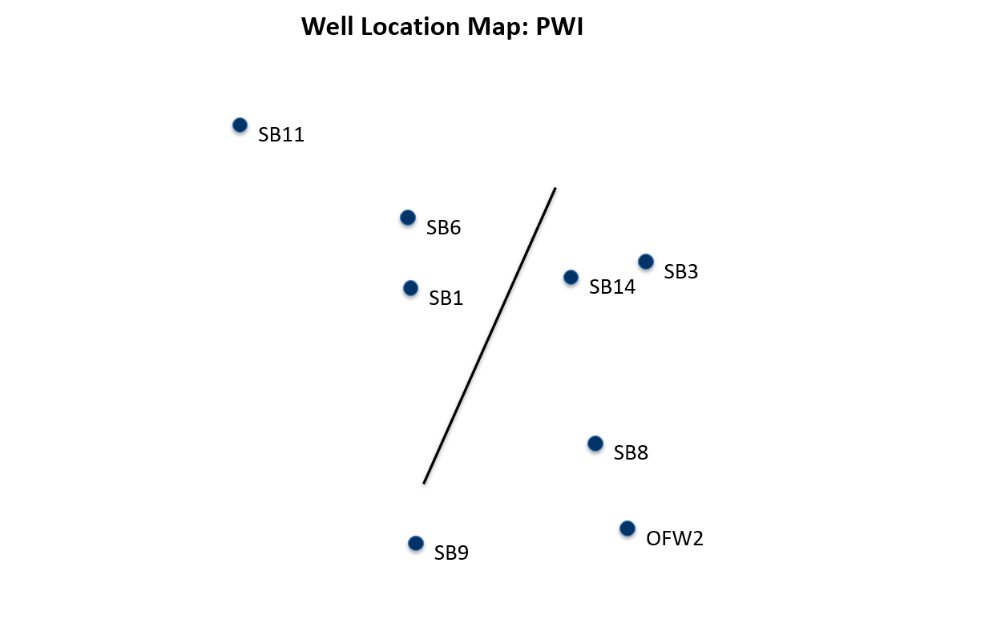
3. DATA REQUIREMENTS
To use this tool, your data must be organized in a specific folder.
A. The Project Folder
Create a dedicated folder for your
project. I recommend creating a [BoreholeSectionPro] main directory with
subfolders for each project. A project folder must contain:
-
Wells.csv: A master file containing the geographic locations of all borehole
collars.
-
Individual Well Files: Separate BTV CSV files for each borehole containing the
structural readings and drift measurements.
The well-file names
must be the same as those used in the Wells.csv file.
For example, for the Wells.csv shown above, the corresponding BTV file names are TW.csv, OW1.csv,
etc.
-
WellLogs: The program also prompts to plot well logs along any borehole
that has a [Wellname]Log.csv name. It's up to you to remember the type
of log that you plot and annotate the log slide accordingly.
B. File Formatting
Wells.csv (Master File)
Required column headers:
-
Well: Borehole ID (e.g., Well1).
-
Longitude: Decimal degrees.
-
Latitude: Decimal degrees.
-
Altitude (m): Elevation of the well collar in meters above sea level.
Individual Well CSVs (The well-file names
must be the same as the well names used in the Wells.csv file)
Required column headers:
-
Altitude (m): Elevation of the specific reading.
-
Dip: True dip angle (0-90°).
-
Azimuth: Dip direction (0-360°).
-
Type: Structural category (Bedding, Layering, Foliation, Fault, Cleavage,
Fracture).
-
Kind: Used specifically to identify "Conductive" planes.
-
Optional Drift Columns:
-
BHAzm: Incremental borehole azimuth (0-360°).
-
BHTilt: Incremental borehole tilt/inclination from vertical (0-90°).
. HOW TO RUN THE TOOL. HOW TO RUN THE TOOL
- Launch: Run
or double click on the compiled BoreholeSectionPro_v33.exe. The program
can take up to a minute to load with nothing happening on the screen. Be
patient until you see the 'Select Project Data Folder' menu appear.2.
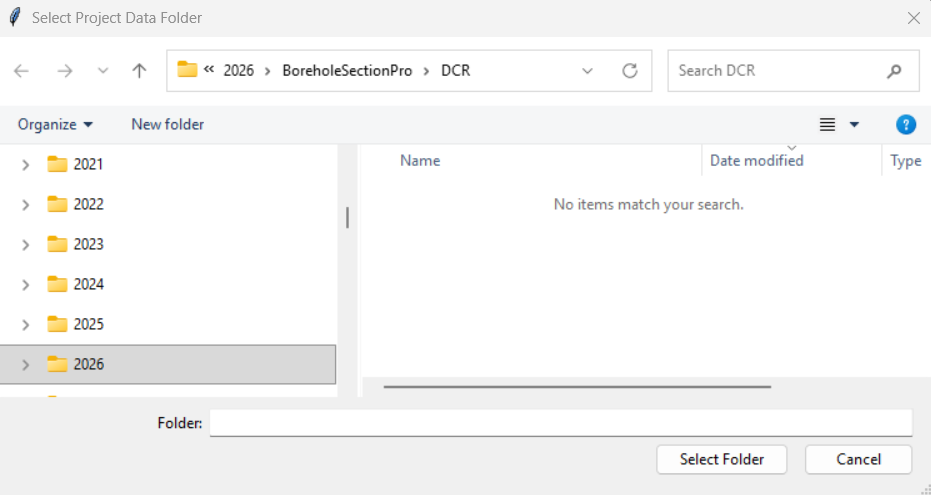
-
Select Folder: A Windows folder browser will appear. Select the project
folder containing your Wells.csv. Once Selected press [Select Folder].
5.
INPUT PARAMETERS
-
Next, slecttTthe Borehole Trace Style:
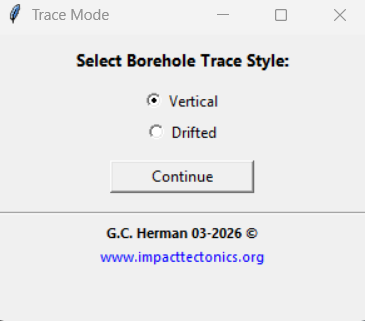
Please note that the [Drifted] option requires BHAZM and BHTILT values in
the BTV tables. Otherwise, breholes are treated as straight vertical lines..
The [Drifted] option uses the borehole offset method described by Herman and
others, 2015).
-
The next prompt sets the cross-section azimuth, scale, and line scale for
the gamma-log traces and various types of planar features. After setting
each variable, press the [Generate Presentation] button.
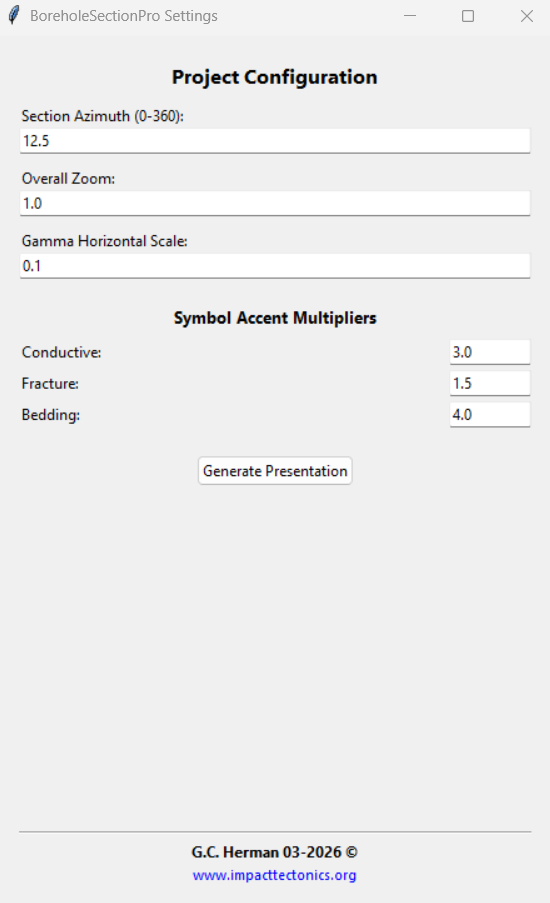
Accent Multipliers: Controls the visual length of structural symbols for
the various Types of structures noted in the BTV tables.
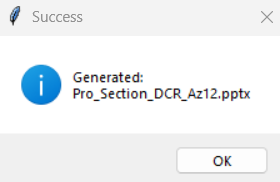
Upon successful execution the following window
appears:
6. INTERPRETING THE OUPUT
The tool produces either a two- or three-slide PowerPoint presentation using the
following naming convention: Pro_Section_[Project]_Az[#].pptx. Two slides
are produced without gamma logs, and three slides are produced if a [WellnamGAMMA.csv]
file(s) are in the directory as illustrated in the second example above.
Slide
1: Structural Cross-Section
-
Borehole Traces (Black):
-
In Vertical mode, these are solid black lines.
-
In Drifted mode, the actual path is a solid black line, while a dashed
vertical line (0.5 pt.) is provided as a spatial reference to emphasize
the drift.
-
Structural Symbols (Default Color Key):
-
Green: Primary structures (Bedding, Layering, or Foliation).
-
Blue: Conductive planes.
-
Red: Fractures.
-
Black (1.5 pt.): Faults.
-
Medium Gray: Cleavage.
-
Histograms: Separate rose diagrams for each type with an Orange vector
representing the statistical mean trend.
-
Scale Bar: A 50m scale bar with a center-justified label.
Slide
2: Cross-Section wells, topographic profile and gamma log(s) if plotted,
otherwise, the Well Location Map
-
Gamma-log trace use medium-gray lines of 0.5 pt. weight generated as a
continuous line. The same cross-section elements and positions are used for
the gamma plot as for the BTV-feature plot. Logs are plotted along the
drifted borehole if that program option is chosen.
-
Map black dots: Represent well collar locations.
-
Map black Trace: Shows the orientation of the cross-section relative to the
wells.
. TECHNICAL NOTES & TROUBLESHOOTINGG
-
nductive variables take precedent. So if a plane is marked primarily as
bedding and then conductive, it will be plotted as a conductive plane using
the same symbology as for conductive fractures, faults, etc.Conductive variables take precedent. So if a plane is marked primarily as
bedding and then conductive, it will be plotted as a conductive plane using
the same symbology as for conductive fractures, faults, etc.
-
Drift Logic: Drift is calculated incrementally from the collar downward. If
BHAZM or BHTILT data is missing for a specific depth, that segment is
treated as vertical.
-
Scale Integrity: The section maintains a 1:1 aspect ratio, ensuring apparent
dips are visually accurate without vertical exaggeration.
-
File Access: Ensure the PowerPoint file is closed before running the tool,
or a "Permission Error" will occur.
8. REFERENCE
Herman, G.C., French, M.A., and Curran, John, 2015 ,
Borehole Geophysical Logs and Geological
Interpretation of Two Deep, Open Boreholes in the Passaic Formation, Elizabeth
City, Union County, New Jersey (9.1
MB PDF): NJ Geological & Water Survey Geological Series Report GSR 42, 26 p., 2
appendixes, 1 zip
file (14.5
MB).

